Adopted from DataOne.
Data Management Made a Little Less Scary
Strategies to Meet You Where You Are
2023-01-13
Goals for Seminar
Define data management and data manager/scientist role.
Share concepts and examples.
Empower you to take this information back with you into your day-to-day work:
Start Small
Happy Medium
Bring It On!

2020 NOAA Data Strategy

“Data are at the heart of NOAA’s $5 billion per year enterprise. … NOAA data are a critical strategic asset used to ensure accountability, manage operations, and to maintain and enhance the performance of the economy, public health, and welfare.”
Goal 1: Align data management leadership roles across the organization.
Goal 2: Govern and manage data strategically to most effectively steward the US taxpayers’ investment.
Goal 3: Share data as openly and widely as possible to promote maximum utilization of NOAA data.
Goal 4: Promote data innovation and quality improvements to facilitate science and support data-driven decision making.
Goal 5: Engage stakeholders and leverage partnerships to maximize the value of NOAA data to the Nation.
Overview
The data we collect, manage, and analyze today will continue to be available and used by staff in the future (and outside of NOAA). It is, therefore, important to maintain, organize and share our data in a way that will be useful and meaningful to current-us and future-us.
But, data storage is costly, in terms of space for storing data, space for backing up data, and time for managing, organizing and documenting data, and so on…
We want to be mindful in our data management strategies and application.
At least 50% of data management is people-related.
Plan
Start your project and research off with good planning and design.
Data management is just one part of this early planning (and the only focus of this presentation).
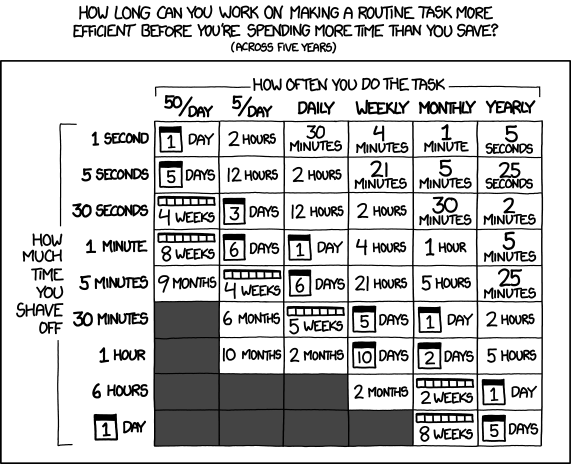
Early planning takes a lot of work, but working through all these steps from the beginning will save you so much time later.

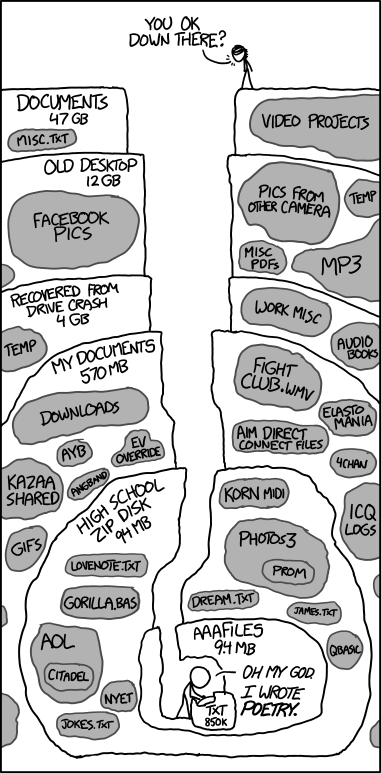
Plan: Folder Organization Ideas
Consider how to organize folders (by date, project, species).
Create folders with a top-down hierarchy.
Organize images separately.
Don’t store final data only on your laptop!
If you’re going to do a big reorganization, consider deleting and archiving things first.
For program-wide efforts, work together as a team to come up with different ways to store data, test out some mock-ups, and settle on a solution that works best for the group.
Establish a system for version control (e.g. file-naming, Git). Not everything needs version control. Delete obsolete versions of files.
Maintain whatever system you come up with – check in, adjust it, and clean it up annually.
Plan: Folder Organization: Personal
Personal File Management (could be on computer or in user’s folder)

Plan: Folder Organization: Program
Main Folder Structure

Subfolders within…Data

…ProgramMgmt & Projects

Plan: Google Drive Organization
PEP Centralized Google Drive Folder Structure

LAN vs Google Drive
I can’t tell you what is best for you or your project or your program.
This should be a group discussion and decision.
Document this for yourself and future users (read_me file, project manual, etc.)
Plan: File Naming
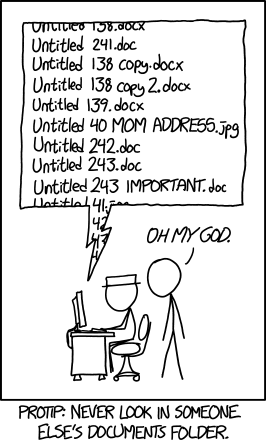
File names ideally describe the project, file contents, location, and date – and should be unique enough to stand alone as file descriptions.
File names should be:
Human-readable
Machine-readable
Plays well with default ordering (!)
- This may mean different solutions for different projects/reasons.
- Order by date, number, name, etc.
- Most general to most specific.
Same rules apply to folder names!
Plan: Date/Time Formats
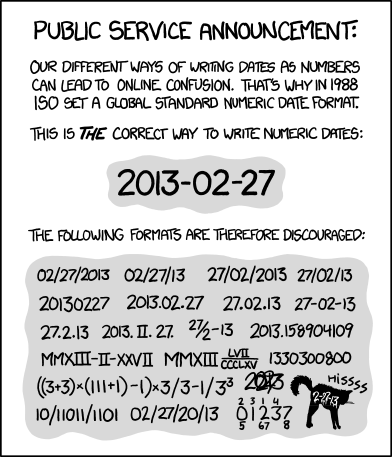
In data and in folder/file names, dates should formatted to meet ISO 8601 standards:
YYYY-MM-DD
YYYYMMDD
YYYY-MM
YYYY-Www (e.g. 2023-W03) if you use week data
Thh:mm:ss.sss (using the 24-hour clock system)
We work across time zones, which makes data collection and management particularly complicated. Consider standardizing date/time data to GMT.
Plan: Reproducibility
Think about how you’re going to…
Process and document your data processing steps.
Code is a really nice way to do this. It also saves you time later, if you have to redo anything.
If that’s scary or not in your toolkit, writing down the (detailed) steps in a (shared) document is also totally okay.
Archive versions of the data used for analyses, if they cannot be otherwise recreated.
Come up with a plan for what you need to do with your data to meet PARR requirements. Do this early, and it becomes an easy box-checking exercise later.
Plan: Take-away Actions
Start Small
Pick one thing that you think would be most beneficial for you to try. Build incrementally.
Don’t try to do everything all at once or go back through all your older work. Start small with something new(ish).
Happy Medium
- Work with other members of your project/program to start to bring more of these measures into your work.
Bring It On!
Develop a comprehensive data management plan for your project/program.
Use common planning and structures across program projects.
Clean up and reorganize your own/project/program file organization.

Collect: Data Collection Template
Main Folder Structure

Subfolder Structure

Collect: Wide vs Long Formats
Wide Format

Long Format (preferred)

Collect: Archive/Storage
Store data in non-proprietary formats (when possible) that are easy to work with in programming software:
CSV
Text files
Database - benefit of related data and lookup values
PostgreSQL / SQL Server / Azure
Geodatabases
Avoid long field names.
Avoid using special characters and spaces in field names.
Store spatial data in appropriate projections. Decimal degrees in WGS-84 are a good default option.
PEP Database Schemas

Collect: Example #1 (glacial database)
PostgreSQL Database Structure (data are atomized within fields and link across tables)

Collect: Example #1 (glacial database)
Data Entry Forms (in Access)

Collect: Example #1 (glacial database)
Process Tracking (in Access)
Collect: Example #1 (glacial database)
Dataset Tracking (in Access)
Collect: Take-away Actions
Start Small
Rethink how you collect and store data while in the field.
Come up with a more standardized folder structure and file naming approach.
Happy Medium
Migrate your data to a long data format.
Re-evaluate datasheets and other data collection strategies.
Bring It On!
Migrate data to a database.
Develop cloud-based data collection tools for the field.
Automate data collection, where possible.
Assure
This is an easy step to overlook. Doing it well takes time…
Things to look at in your data:
Consistency in values throughout data collection.
Reasonable min-max, average, range values for each field (query-based or graphically).
Missing data.
Large gaps in data (spatial or temporal bias?).
Double-checking data that were manually entered.
Logical checks.
Assign quality flags to records to “remove” bad records.
Skipping this step can be catastrophic…
Assure: Example #1 (in-field report)
Review field data to ensure there were no issues with initial data collection…


Assure: Example #2 (in database)
In a database, tables are where your data are stored. Queries are layers that exist on top of that table that summarize, filter. or order your data…they do not make another copy of the data. When your underlying data change, the data in the query also change automatically.
Using queries to standardize extraction and to complete quality checks…

Assure: Take-away Actions
Start Small
Review data/datasheets in the field to catch problems early.
Think of some new ways to quality check your data (e.g., figures in Excel, manual review).
Happy Medium
Assure quality data before you collect or enter data (e.g., drop-down menus in a spreadsheet/database).
Identify ways to differentiate missing and NULL values.
Bring It On!
- Develop a systematic and automated quality assurance process to run on data after data collection (e.g. database queries, reports generated in R).
Describe
This is another step that takes a lot of time to do well, but your future self will be really appreciative of your current self doing a thorough job.
Describe the data organization.
Describe who did what and the appropriate contact information.
Describe the scientific context.
Describe the data and parameters.
This is doesn’t just have to be done in InPort.
**Any dataset metadata records created in InPort are required to have their data available online within one year of when the metadata record was created. This does not apply to project-level metadata records (FYI).**
Describe: Example #1 (InPort)
PEP Metadata Repository

Describe: Example #2 (dashboard)
Project management tracking within PEP dashboard

Describe: Example #3 (GitHub)
Project management on GitHub (developed by Josh London)

Describe: Take-away Actions
Start Small
- Start a shared document for tracking processing steps.
- Start an on-going meeting notes document.
Happy Medium
Develop a Google Space for sharing information (rather than through email).
Use Google Tasks to track work.
Bring It On!
- Project and issue tracking on GitHub.
- Develop project/program-wide method for tracking information.
Discover: Example #1 (AGOL)
Data Portal (for sharing data with AK Regional Office)

Discover: Example #2 (Shiny App)
Interactive application (for exploring harbor seal abundance estimates)

Preserve/Discover: Take-away Actions
Start Small
- Share a new (small) dataset (that was not previously available).
Happy Medium
- Share a new dataset with the AKRO through the ArcGIS online portal.
Bring It On!
- Develop custom portals for viewing and interacting with your data.
Integrate/Analyze
For an analyses, you might be working with a single data set or integrating a number of datasets (e.g. sightings and environmental covariates).
Things to consider:
Identify and document those data within the documentation of the new derived data set.
Make the extraction and integration of the data reproducible (e.g. stored query, stored output, programmatic extraction).
Ensure any “quirks” in the data that are clearly understood by those analyzing the data, if that’s not you.
Think early about how you’re going to share data and/or code for the analysis.
Integrate: Example #1 (getting data)
R package (to simplify and ensure consistent retrieval from the database)

Integrate/Analyze: Take-away Actions
Start Small
- Make a folder for storing all the data products (and maybe code) for an analysis.
Happy Medium
- Brainstorm a new way to work through an analyses with these considerations with a colleague.
Bring It On!
Use Git for storing all the data products (and maybe code) for an analysis.
Develop an R package detailing the analyses (for code someone else might use).
Data-related Positions

Role is particularly important in the planning and collecting phases of the data management life cycle.
The assuring, describing, preserving and discovering phases are the logical places where this role fits into the larger project.
By the time the work gets to the integrating and analyzing phases, the person (or people) in this role knows the nuances of the data backwards and forwards.
*Depending on the project/program structure, this might be one person or many people.
Resources
- PEP Data Management Plan
- Biological Observation Data Standardization - A Primer for Data Managers
- DataOne Primer on Data Management
- Harvard Biomedical Data Lifecycle
- NOAA Data Strategy: Maximizing the Value of NOAA Data
- ISO 8601 Standards for date/time
Thank you to everyone who contributed ideas for helping to formulate parts of this talk!